← All workQLeak-test quality dashboardEngine manufacturing · Quality & SPC web app
Web app·Data visualisation
Every engine, every curve, clear at a glance.
A commercial-vehicle engine plant tests every engine for leaks, and the results sat in raw test files. We built a live quality and SPC dashboard that turns them into yield, trends and waveforms the whole line can act on.
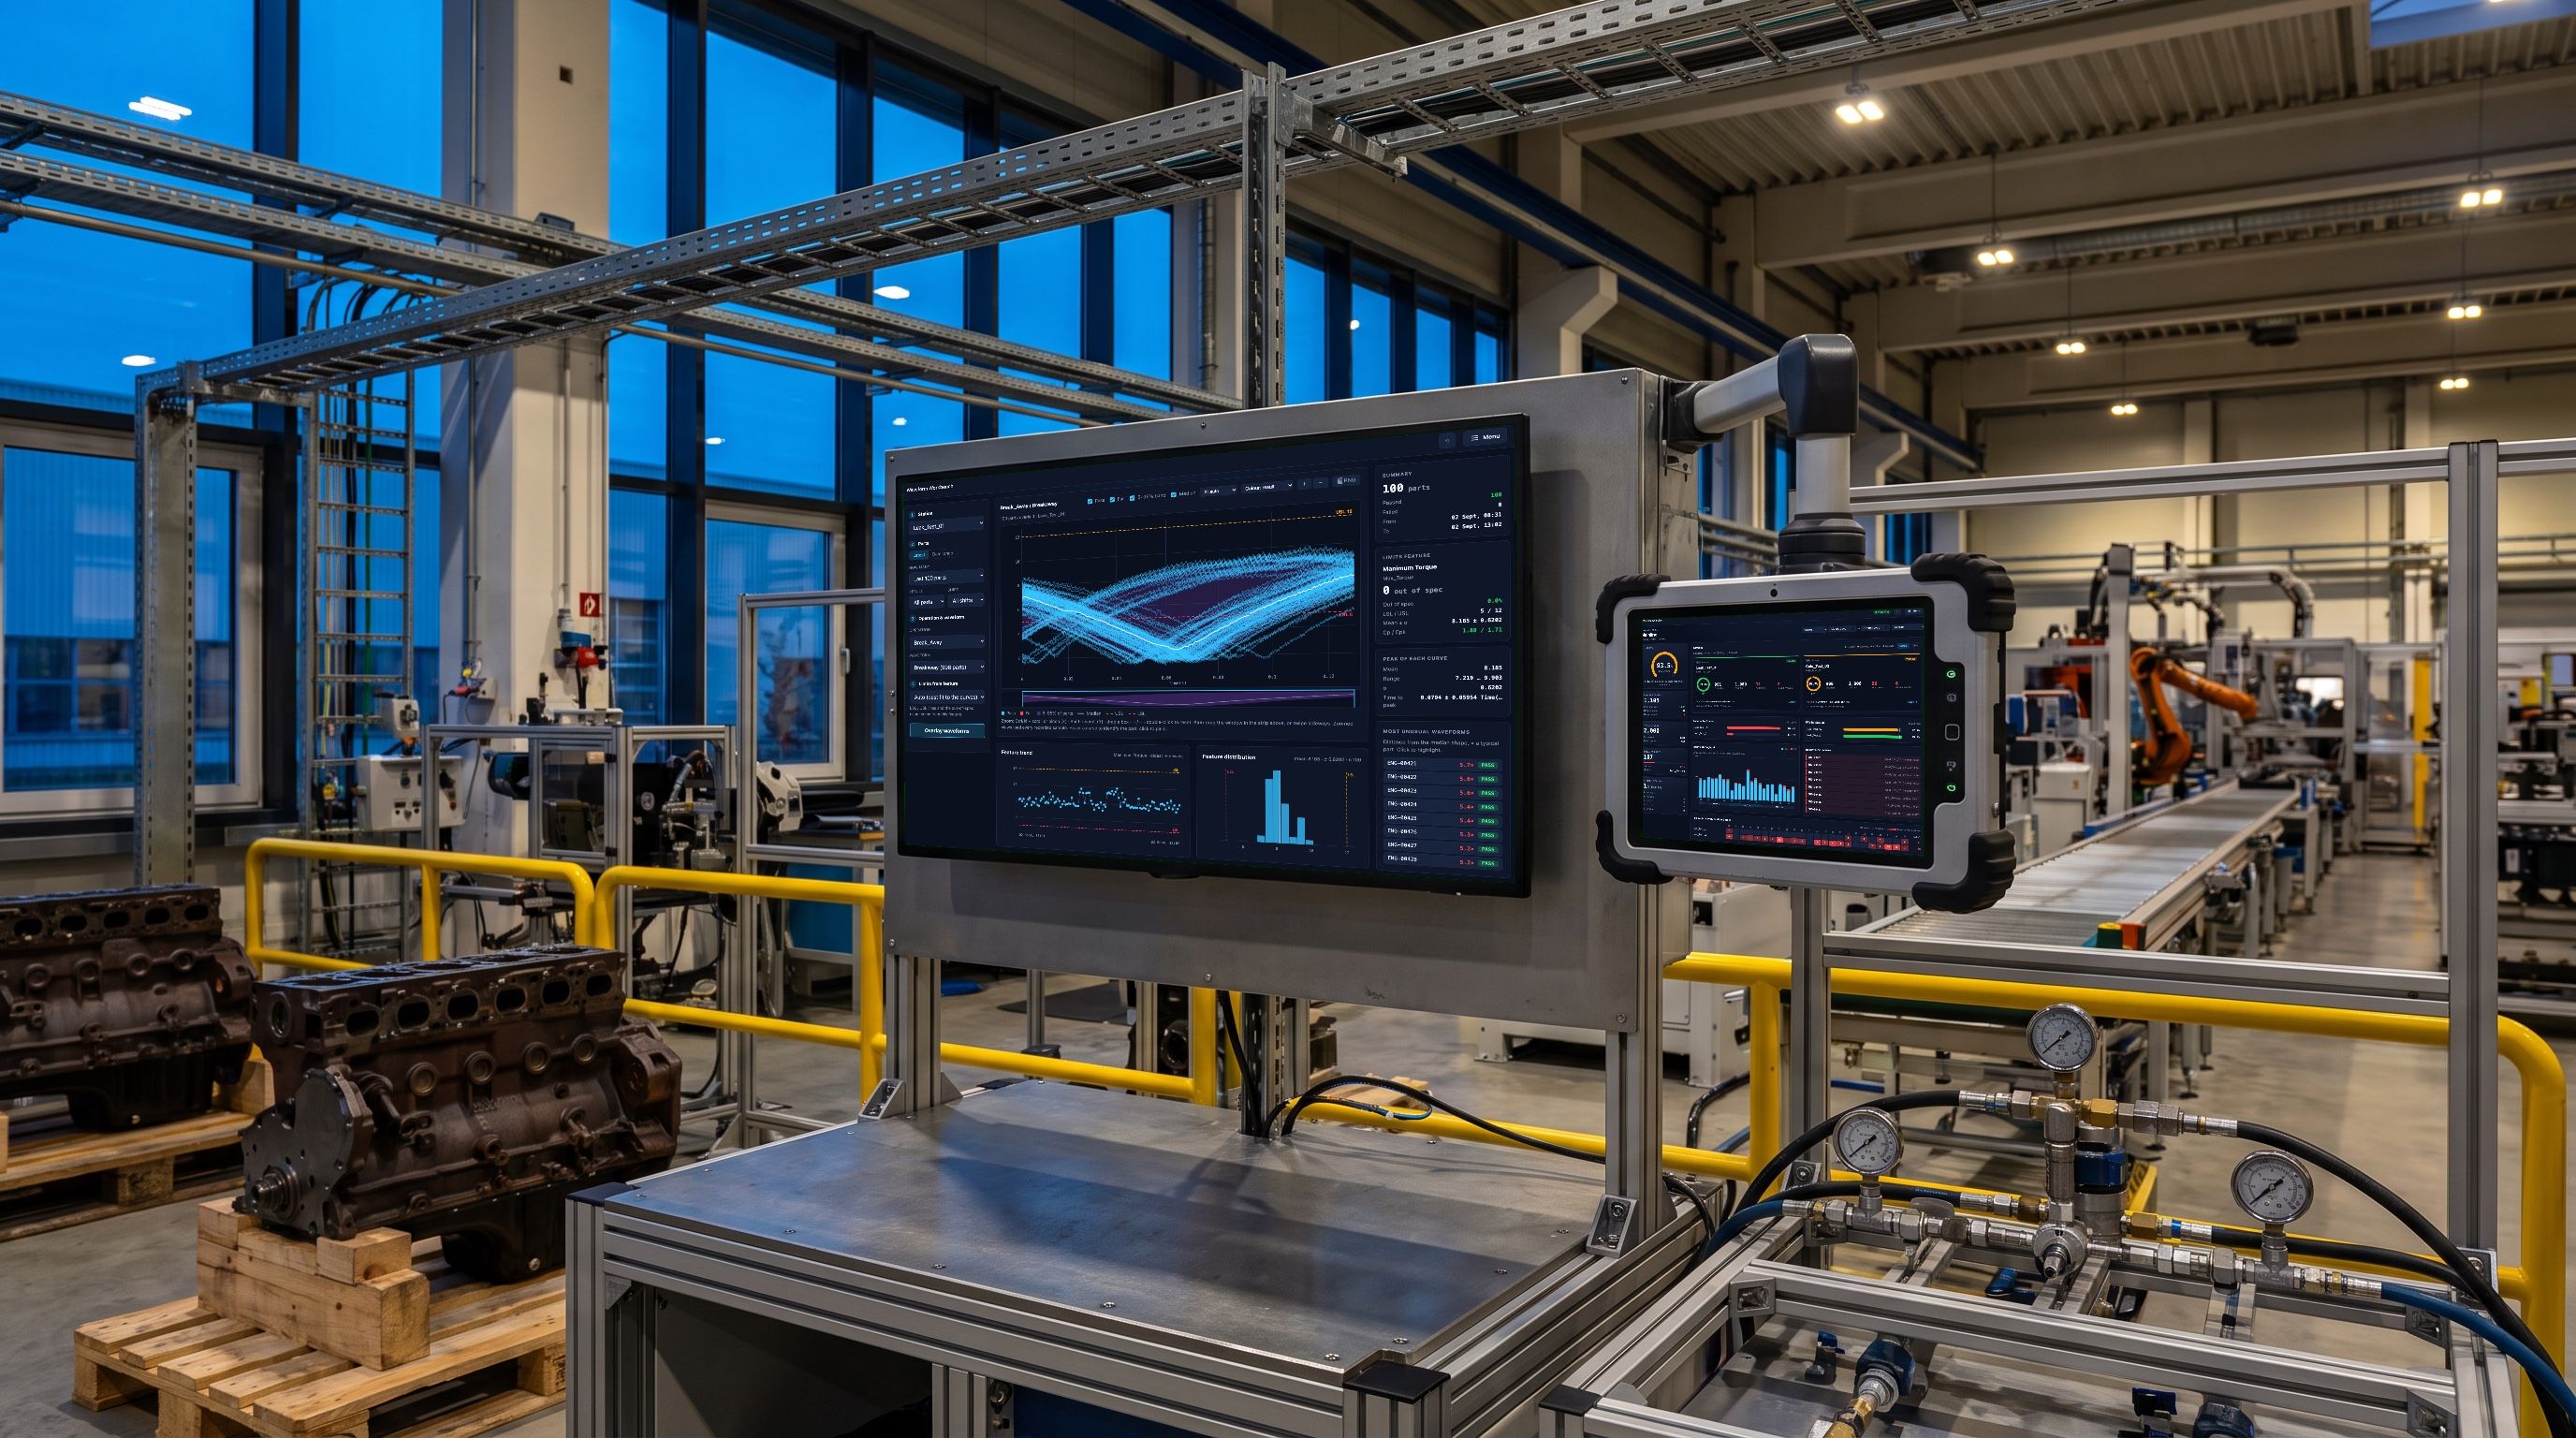
Confidential client. Names, people, places and contact details in these screens are changed. The interface is exactly as we built it.
01
Clarity at a glance
Yield, failures and throughput for the whole line, readable from across the floor.


02
Designed as one
Every chart, gauge and waveform speaks the same visual language.


03
Data you can act on
From one failed cycle to a hundred overlaid waveforms in a single click.


Same test rigs, same engines. Now every result is visible the moment it happens.
- Live yield and failures for the whole line
- Waveforms compared across hundreds of engines
- Dark and light themes for every shift
Cannyworx
Start a project →